We are committed to making every dollar count. Thanks to the compassion of our supporters, we turn funding into life-changing programs for children. By sharing our financial profile, we provide a clear view of how contributions translate into impact. This transparency helps us measure our effectiveness, improve our services and reinforce the trust of those we serve.
Discover how we allocated resources in 2025 below.
How the funds were spent
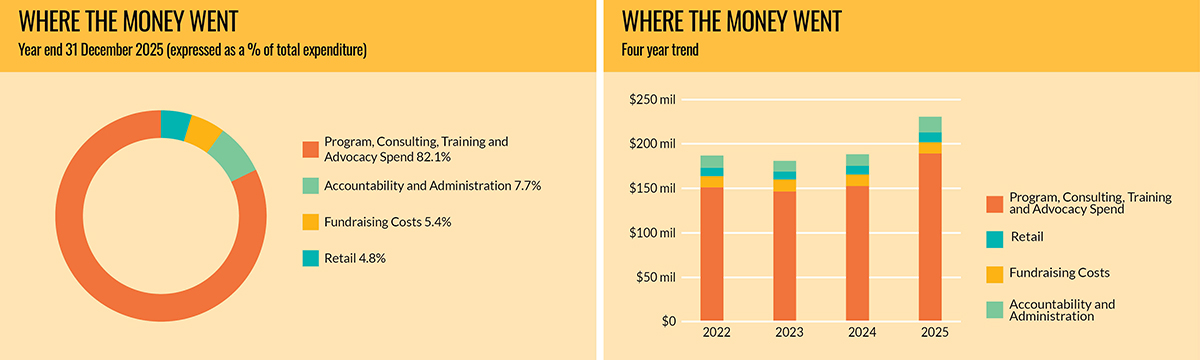
We have a conservative approach towards managing and protecting donations. From every dollar spent in 2025:
- 82 cents went directly to benefit children through our health, education, child protection and humanitarian response programs, and through advocating for child rights and increasing public awareness of international aid and development issues.
- 5 cents went towards raising the funds we need to deliver these programs.
- 8 cents were allocated to administration costs to make sure we have the talented people, infrastructure, and systems we need to manage and deliver our programs for children in Australia and across the world.
- 5 cents were invested in our retail stores.
Where the money came from
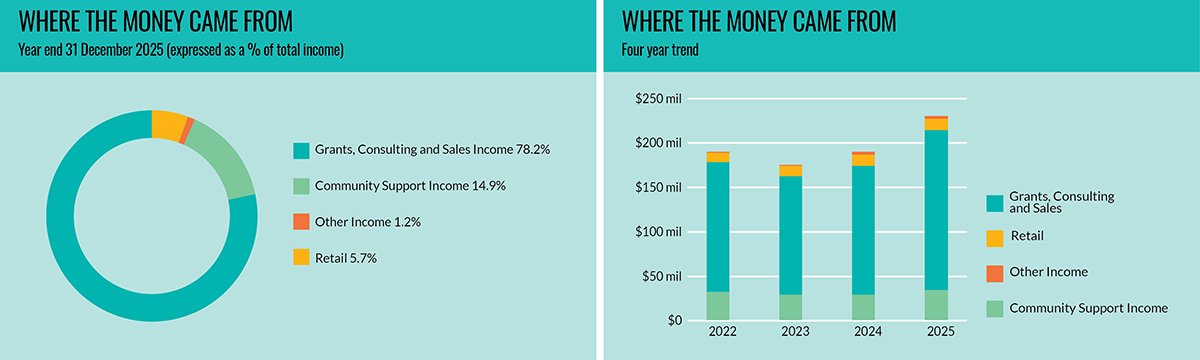
In 2025, Save the Children Australia recorded a total income of $230.7 million, an increase of $40.1m or 21% from 2024. This was primarily due to growth in Grant, Consulting & Sales Income ($34.4m or 23%) as we continue to diversify our income streams. Other income decreased by $0.4m (13%) largely due to a decrease in sundry income. Community support income increased by $5.6m (20%) from 2024 due to increase in regular giving and appeals. Income from retail activities continues to grow with an increase of $0.8m from 2024.
Explanation of Terms
Community support income: Donations and bequests received from the Australian public and corporations. This generous ongoing support from the public enables us to effectively deliver programs to children worldwide and to respond to emergencies such as the Ukraine conflict, Pacific Child Emergency Fund and Tropical Cyclone Emergency Responses.
Grants, consulting, and sales income: Grants received from the Australian Government’s overseas aid program, other Australian Government departments, government bodies, UN agencies, corporations, philanthropy and international organisations. Consulting income, training fees, sales revenue, and revenue from other mission related activities by our various social ventures.
Retail: Includes revenue from our retail stores.
Other income: Includes investment income.
Where the money went
The percentage of overall spend has increased by 22.3% or $42m and this is attributable to an increase in accountability and administration spend by 0.7% to 7.7% and programming, consulting, and training expenditure increase in 2025 of 1.2% to 82.1%. This is partially offset by fundraising costs decrease by $0.6m or 1.5% from 2024 and a marginal decrease in retail spend of 0.4% as a proportion of total spend, representing an increase of $1.3m in actual spending.
Explanation of terms
Program, consulting, and training spend include:
- Long-term development and emergency response work across both international and domestic projects.
- Community education that includes costs related to informing and educating the Australian community of development, humanitarian, and global justice issues.
- Other mission-related expenditure within our social ventures.
Fundraising costs: Costs associated with developing and securing our donor supporter base to attract donations to fund our project and advocacy work.
Accountability and administration expenses: Administrative and other costs required to efficiently run the organisation. It includes items such as staff costs in finance, IT, human resources, administration, office maintenance, audit and legal fees, insurance premiums and IT equipment costs, as well as investments in further developing the organisation’s capabilities and infrastructure.
Project expenditure ratio
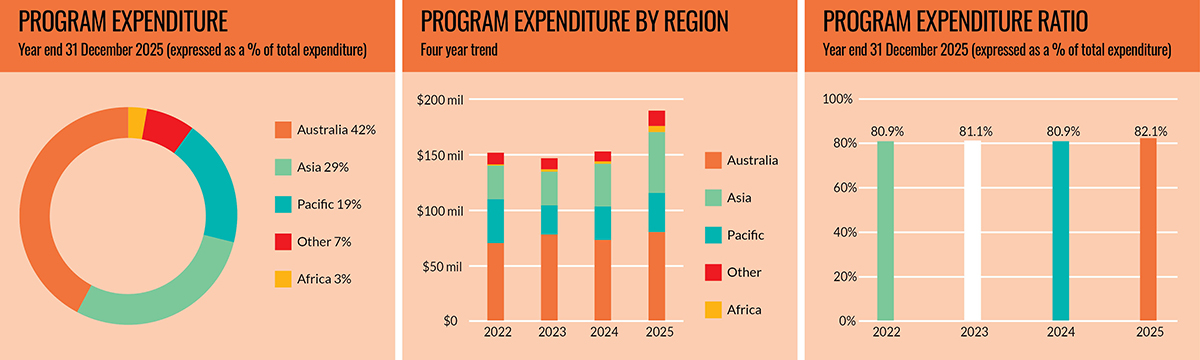
The total amount spent on projects, including project support costs, consulting, training, and community education. This is expressed as a percentage of total expenditure.
Our program, consulting and training expenditure ratio has increased from 80.9% in 2024 to 82.1% with dollar spend increasing by $36.8m. This is reflective of increased programming in Africa and the Pacific, and strong growth in Asia. Australian domestic programming and other regions spend has increased from 2024 with strong growth domestically.
Administration cost ratio
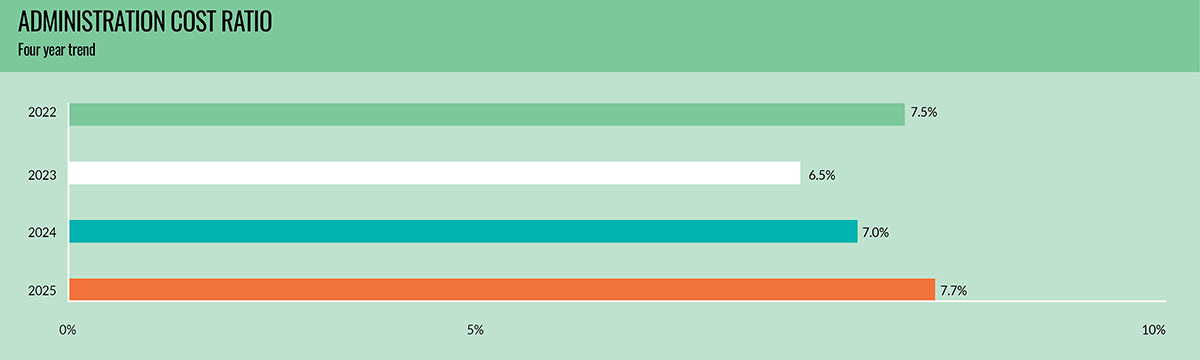
The total administration costs expressed as a percentage of total expenditure.
The administration cost ratio in 2025 has increased to 7.7% from 7% in 2024. We continue to remain focused on providing the right support to our growing programs portfolio, whilst ensuring we do this efficiently to maintain this ratio at or below 10%.
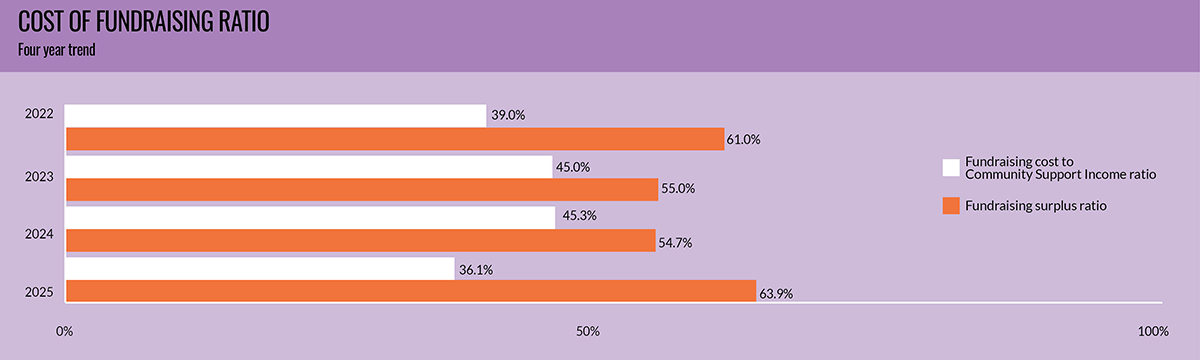
Cost of fundraising ratio
The total fundraising cost as a percentage of community support income.
Net surplus from fundraising ratio is the balance of revenue from community support income after deducting fundraising costs.
Our cost of fundraising ratio decreased to 36.1% in 2025 from 45.3% in 2024. This is reflective of the increase in community income, whilst keeping a consistent level of expenditure on community fundraising and spend in channels used to acquire regular givers in 2025. We continue to focus on investment in our fundraising across multiple channels and anticipate reverting to similar historical trends in the future. Another ratio often given attention is the fundraising cost ratio as a percentage of total revenue. In 2025 this was 5.4%, a decrease from the 6.8% recorded in 2024 due to the increase of $42m in total income in 2025 coupled with a similar level of spend in channels used to acquire regular givers.
Explanation for income streams and expenditure categories
In the full audited financial statements, retail and social enterprise results are combined under commercial activities. In the annual report financial brief and graphs, retail income and expenditure have been disclosed separately and social enterprise income combined with grants, consulting and sales income for revenue and program, consulting and training spend for expenditure.

In 2025, Save the Children Australia was supported by the Australian Government through the Australian NGO Cooperation Program (ANCP) to implement programs in Cambodia, Indonesia, Iraq, Papua New Guinea, Philippines, Solomon Islands, Sri Lanka, Tonga, Vanuatu and Vietnam; through the Australian Humanitarian Partnership (AHP) to implement programs in Bangladesh, Indonesia, Myanmar, Pakistan, Papua New Guinea, Philippines, Solomon Islands, Sri Lanka, Vanuatu, Vietnam; and through other Department of Foreign Affairs and Trade (DFAT) support for Lao PDR, Papua New Guinea, Solomon Islands and Vanuatu.
Save the Children Australia is a member of the Emergency Action Alliance (EAA), a collective of Australia-based aid organisations that uses its combined reach and resources to raise more money for greater impact.
Save the Children is a signatory to the ACFID Code of Conduct, a voluntary self-regulatory sector code of good practice. We are committed to fully adhering to the Code, conducting our work with transparency, accountability and integrity.