Save the Children Australia has a proud history of maximising the impact of funding and donations from our dedicated supporters. By sharing our financial profile, we connect our community with the incredible outcomes achieved through their support. This transparency allows us to assess our impact, enhance our services, and earn trust with the communities we proudly serve. Explore our financial profile for 2022 below.
How the funds were spent
We have a conservative approach towards managing and protecting donations.
From every dollar spent in 2022:
- 81 cents went directly to benefit children through our health, education, child protection and humanitarian response programs, and through increasing public awareness of international aid and development issues.
- 7 cents went towards raising the funds we need to deliver these programs.
- 7 cents were allocated to administration costs to make sure we have the talented people, infrastructure, and systems we need to manage and deliver our programs for children in Australia and across the world.
- 5 cents were invested in our retail stores.
Where the money came from
In 2022, Save the Children Australia recorded total income of $191.0 million, an increase of $11.3m or 6.3% from 2021. This was primarily due to growth in Grant, Consulting & Sales Income ($8.1m or 5.8%) as we continue to diversify our income streams. Other income increased by $0.1m (10.0%) largely due to higher interest rates in 2022. Community support income increased by $2.0m (6.7%) from 2021 because of record Christmas appeals and growth in our regular giving donor base. Income from retail activities was slowly recovering from the impact of rolling lockdowns in the past year due to COVID and was able to record an increase of $0.1m from 2021.
Explanation of Terms
Community support income: Donations, fundraising, legacies and bequests received from the Australian public and corporations. Continued generous public support enables our community support income to assist us to effectively deliver programs to children and to respond to emergencies such as the Ukraine conflict and Tonga appeals.
Grants, consulting, and sales income: Grants received from the Australian Government’s overseas aid program, other Australian Government departments, government bodies, Corporates, philanthropy and international organisations. Consulting income, training fees, sales revenue and revenue from other mission related activities by our various social ventures.
Retail: Includes revenue from our retail stores.
Other income: Includes investment income.
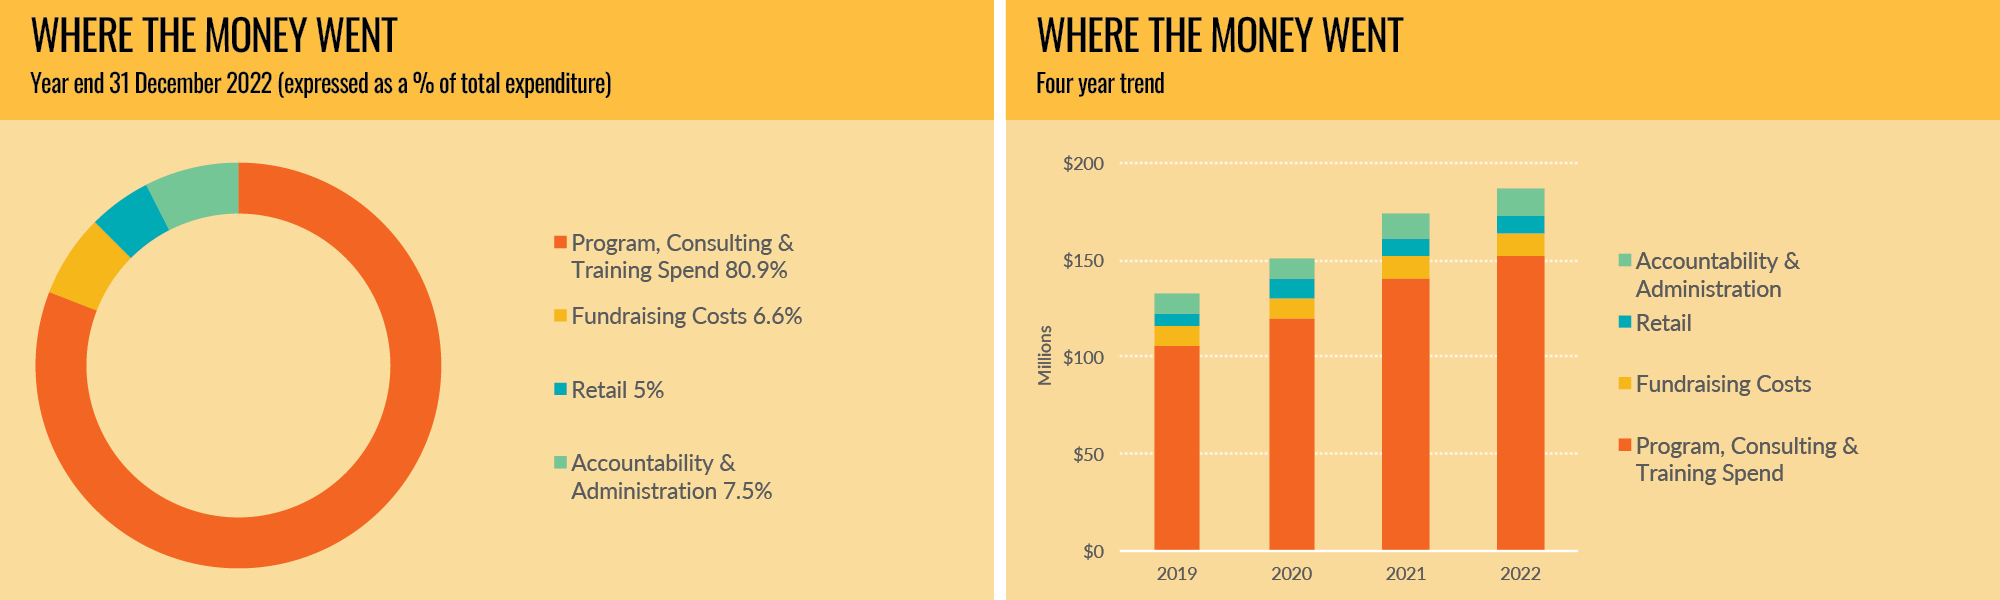
Where the money went
The percentage of overall spend attributable to programming, consulting, and training increased by 0.5% to 80.9%, driven by an increase in spend from $140.1m in 2021 to $151.4m in 2022. Our retail activities had a marginal increase since the national Covid lock-downs ended ($0.6m or 6.2%). There was a further reduction in fundraising costs in 2022 of $0.2m and a decrease in proportion of our fundraising activities spend marginally by 0.6% to 6.6%. Despite the continued growth in the organisation’s accountability and administration expenditure, proportionally this expenditure only increased by 0.2% to 7.5%.
Explanation of terms
Program, consulting, and training spend include:
- Long-term development and emergency response work across both international and domestic projects.
- Community education that includes costs related to informing and educating the Australian community of development, humanitarian, and global justice issues.
- Other mission-related expenditure within our social ventures.
Fundraising costs: Costs associated with developing and securing our donor supporter base to attract donations to fund our project and advocacy work.
Accountability and administration expenses: Administrative and other costs required to efficiently run the organisation. It includes items such as staff costs in finance, IT, human resources, administration, office maintenance, audit and legal fees, insurance premiums and IT equipment costs, as well as investments in further developing the organisation’s capabilities and infrastructure.
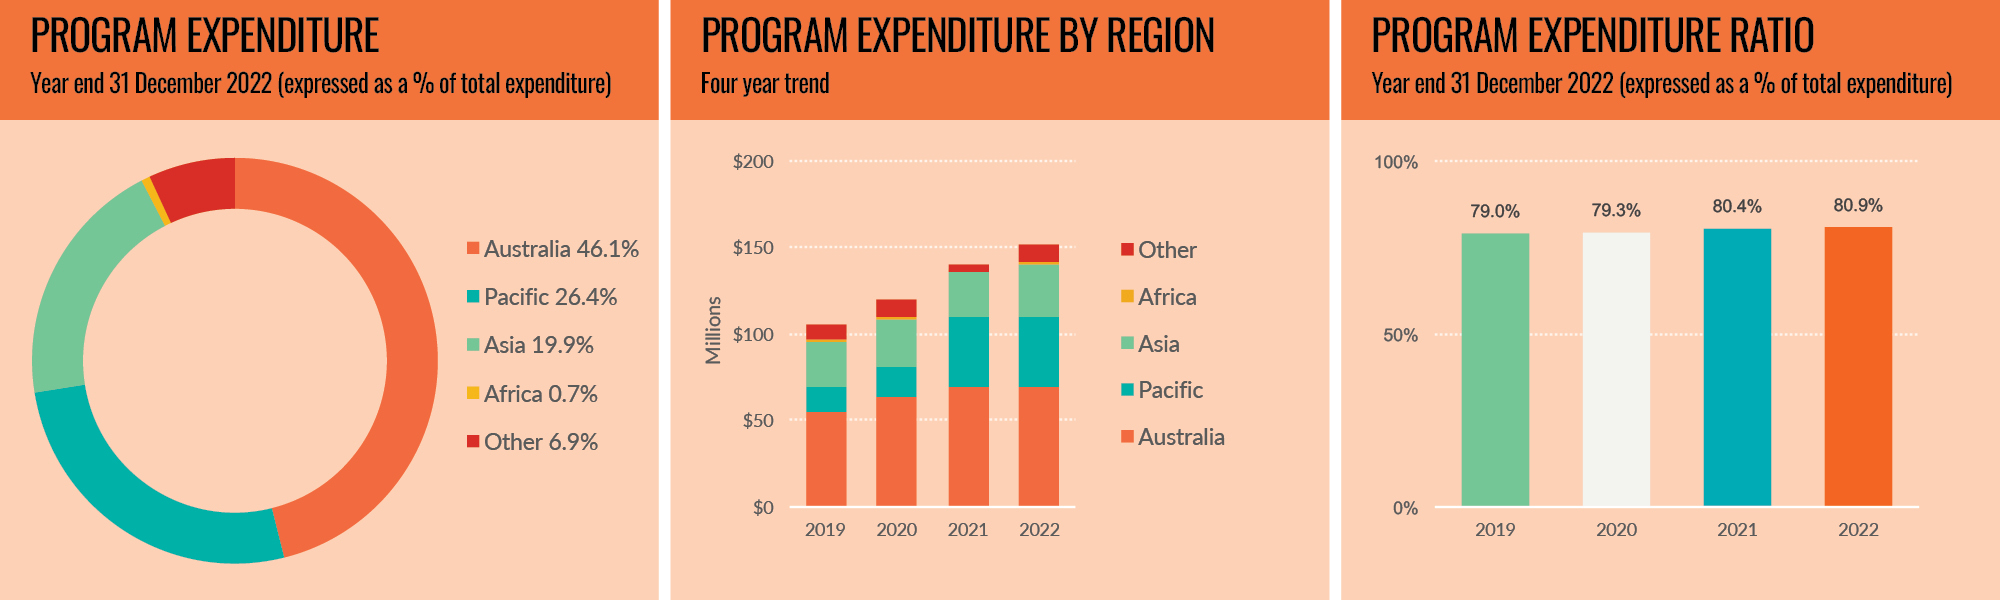
Project expenditure ratio
The total amount spent on projects, including project support costs, consulting, training, and community education. This is expressed as a percentage of total expenditure.
Our program, consulting and training expenditure ratio has increased from 80.4% in 2021 to 80.9% and is reflective of increased programming in most regions, highlighted by growth in the Middle East, Europe and Africa, as well as continued growth in mission-related activities undertaken by our social ventures.
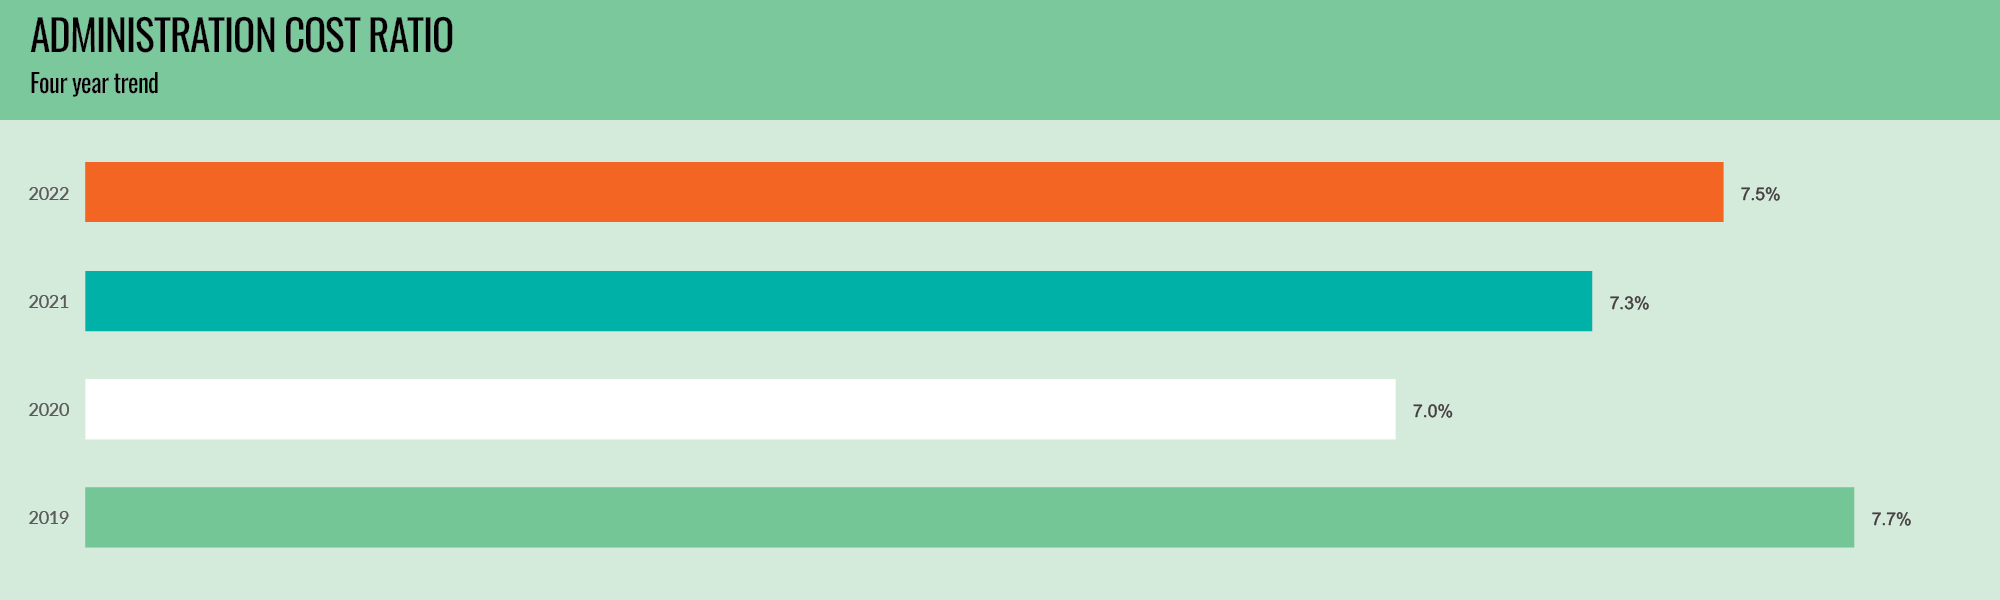
Administration cost ratio
The total administration costs expressed as a percentage of total expenditure.
The administration cost ratio in 2022 has increased to 7.5% from 7.3% in 2021, with administration costs in aggregate increasing by 10.3%. We continue to remain focused on providing the right support to our growing programs portfolio, whilst ensuring we do this efficiently to maintain this ratio at or below 10%.
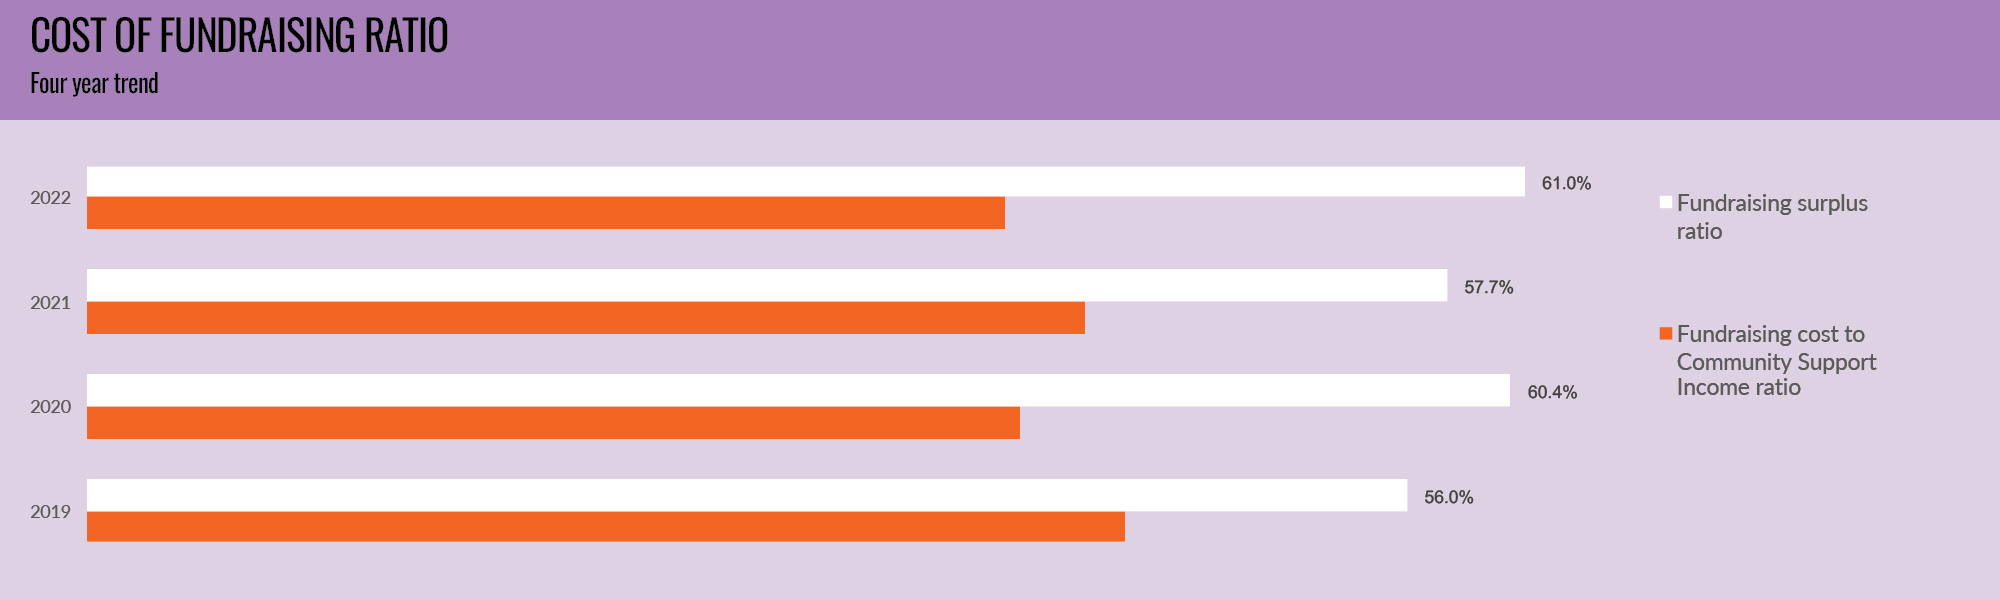
Cost of fundraising ratio
The total fundraising cost as a percentage of community support income.
Net surplus from fundraising ratio is the balance of revenue from community support income after deducting fundraising costs.
Our cost of fundraising ratio decreased to 39.0% in 2022 from 42.3% in 2021. Although there was an increase in income, we remained at the similar level of expenditure on community fundraising and spend in channels used to acquire regular givers in 2022. We continue to focus on investment in our fundraising across multiple channels and anticipate reverting to similar historical trends in the future. Another ratio often given attention is the fundraising cost ratio as a percentage of total revenue. In 2022 this was 6.5%, a decrease from the 7.0% recorded in 2021 due to the increase of $11.3m in total income in 2022 coupled with a similar level of spend in channels used to acquire regular givers.
Explanation for income streams and expenditure categories
In the full audited financial statements, retail and social enterprise results are combined under commercial activities. In the annual report financial brief and graphs, retail income and expenditure have been disclosed separately and social enterprise income combined with grants, consulting and sales income for revenue and program, consulting and training spend for expenditure. Prior year comparatives have been amended to reflect this realignment.
In 2022, Save the Children Australia was supported by the Australian Government through the Australian NGO Cooperation Program (ANCP) to implement programs in Vanuatu, PNG, Solomon Islands, Philippines, Cambodia, Vietnam, Thailand and Tonga; and through the Australian Humanitarian Partnership (AHP) to implement programs in Jordan, PNG, Vanuatu, Solomon Islands, PNG, Indonesia, Laos, Lebanon, Philippines and Tonga.